회사에서 배포 과정에서 Out of Heap Memory가 발생하였다.
<--- Last few GCs --->

[7750:0x6f28be0]   442359 ms: Scavenge 3475.5 (4122.6) -> 3464.8 (4122.6) MB, 25.2 / 0.8 ms  (average mu = 0.342, current mu = 0.318) task;
[7750:0x6f28be0]   442523 ms: Scavenge 3479.0 (4122.6) -> 3473.2 (4122.6) MB, 20.4 / 0.2 ms  (average mu = 0.342, current mu = 0.318) allocation failure;
[7750:0x6f28be0]   442602 ms: Scavenge 3482.8 (4122.6) -> 3478.1 (4126.4) MB, 26.5 / 0.0 ms  (average mu = 0.342, current mu = 0.318) allocation failure;

<--- JS stacktrace --->

FATAL ERROR: Ineffective mark-compacts near heap limit Allocation failed - JavaScript heap out of memory
 1: 0xb85bc0 node::Abort() [/root/action-runners/_work/_tool/node/18.18.2/x64/bin/node]
 2: 0xa94834  [/root/action-runners/_work/_tool/node/18.18.2/x64/bin/node]
 3: 0xd66d10 v8::Utils::ReportOOMFailure(v8::internal::Isolate*, char const*, bool) [/root/action-runners/_work/_tool/node/18.18.2/x64/bin/node]
 4: 0xd670b7 v8::internal::V8::FatalProcessOutOfMemory(v8::internal::Isolate*, char const*, bool) [/root/action-runners/_work/_tool/node/18.18.2/x64/bin/node]
 5: 0xf447c5  [/root/action-runners/_work/_tool/node/18.18.2/x64/bin/node]
 6: 0xf456c8 v8::internal::Heap::RecomputeLimits(v8::internal::GarbageCollector) [/root/action-runners/_work/_tool/node/18.18.2/x64/bin/node]
 7: 0xf55bd3  [/root/action-runners/_work/_tool/node/18.18.2/x64/bin/node]
 8: 0xf56a48 v8::internal::Heap::CollectGarbage(v8::internal::AllocationSpace, v8::internal::GarbageCollectionReason, v8::GCCallbackFlags) [/root/action-runners/_work/_tool/node/18.18.2/x64/bin/node]
 9: 0xf313ae v8::internal::HeapAllocator::AllocateRawWithLightRetrySlowPath(int, v8::internal::AllocationType, v8::internal::AllocationOrigin, v8::internal::AllocationAlignment) [/root/action-runners/_work/_tool/node/18.18.2/x64/bin/node]
10: 0xf32777 v8::internal::HeapAllocator::AllocateRawWithRetryOrFailSlowPath(int, v8::internal::AllocationType, v8::internal::AllocationOrigin, v8::internal::AllocationAlignment) [/root/action-runners/_work/_tool/node/18.18.2/x64/bin/node]
11: 0xf1394a v8::internal::Factory::NewFillerObject(int, v8::internal::AllocationAlignment, v8::internal::AllocationType, v8::internal::AllocationOrigin) [/root/action-runners/_work/_tool/node/18.18.2/x64/bin/node]
12: 0x12d8caf v8::internal::Runtime_AllocateInYoungGeneration(int, unsigned long*, v8::internal::Isolate*) [/root/action-runners/_work/_tool/node/18.18.2/x64/bin/node]
13: 0x1705b39  [/root/action-runners/_work/_tool/node/18.18.2/x64/bin/node]
Aborted
error Command failed with exit code 134.
info Visit https://yarnpkg.com/en/docs/cli/run for documentation about this command.
Test Failed
Github Actions에서 테스트를 실행하면서 힙 메모리가 부족해져버린 것인데,
Github Actions에서는 default로 2GB를 사용한다.
테스트 코드가 얼마나 힙 메모리를 잡아먹는지 살펴보니
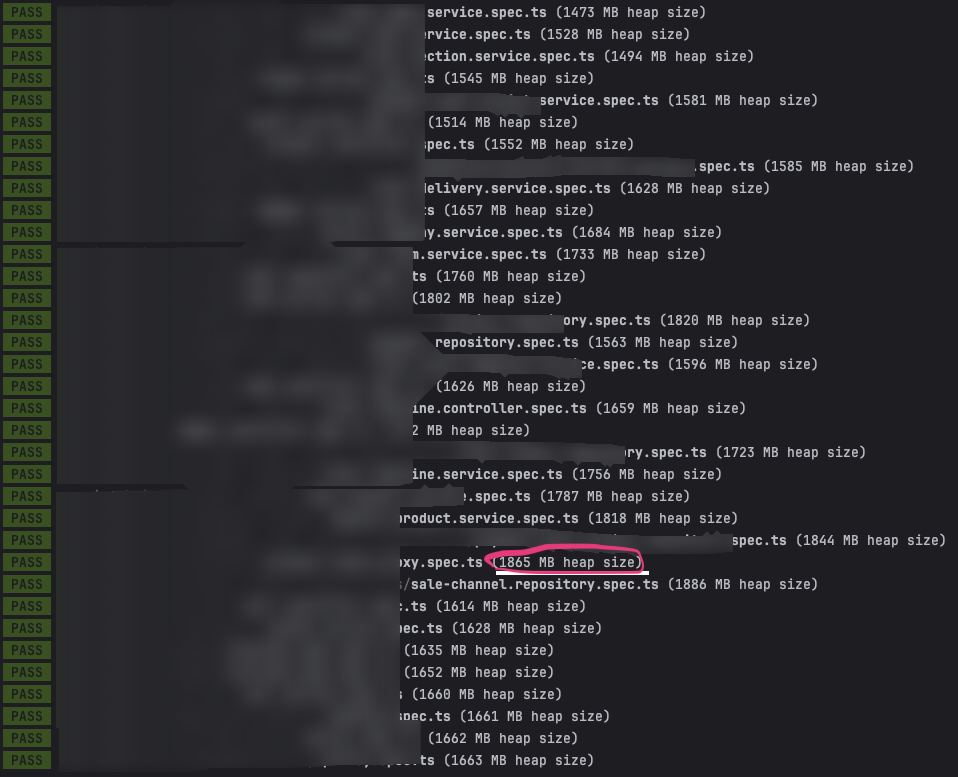
거의 2GB 가까이 잡아먹기 때문에 배포 과정에서 에러가 발생해버린 것..
테스트 코드를 돌리면서 생각보다 많이 잡아먹는 부분에 깜짝 놀랐다.
과연 어떤 부분이 누수가 되고 있는걸까? 힙 덤프를 떠보자!
힙 덤프를 뜨는 방법은 다음과 같다.
$ node --inspect-brk --expose-gc node_modules/.bin/jest --runInBand
현재 jest 를 사용해 jest에서 힙 덤프를 생성하여 분석할 수 있다.
위 명령어를 통해 디버거를 실행하면서 힙 덤프를 생성할 수 있다.
일반적으로 node.js 프로세서에서 js 코드로부터 직접적으로 GC를 제어할 수 없지만
해당 플래그를 통해 수동으로 GC를 호출할 수 있도록 하는 옵션이다.
성능 저하를 유발하므로 프로덕션 환경에서는 주의해서 사용해야한다.
해당 힙덤프는 별도의 모니터링 툴 없이 크롬 브라우저에서 확인이 가능하다.
Chrome 브라우저에서
- chrome://inspect 를 입력
- Open dedicated DevTools For Node 클릭
- 개발자 도구가 열리면 Memory 탭에서 힙 덤프를 저장하고 분석할 수 있다.
시간이 되면 추후 더 분석하기로 한다.
'개발' 카테고리의 다른 글
| 우아한테크캠프 pro 4기 리뷰어 회고 (12) | 2022.07.18 |
|---|

댓글